
labplot
DESCRIPTION:
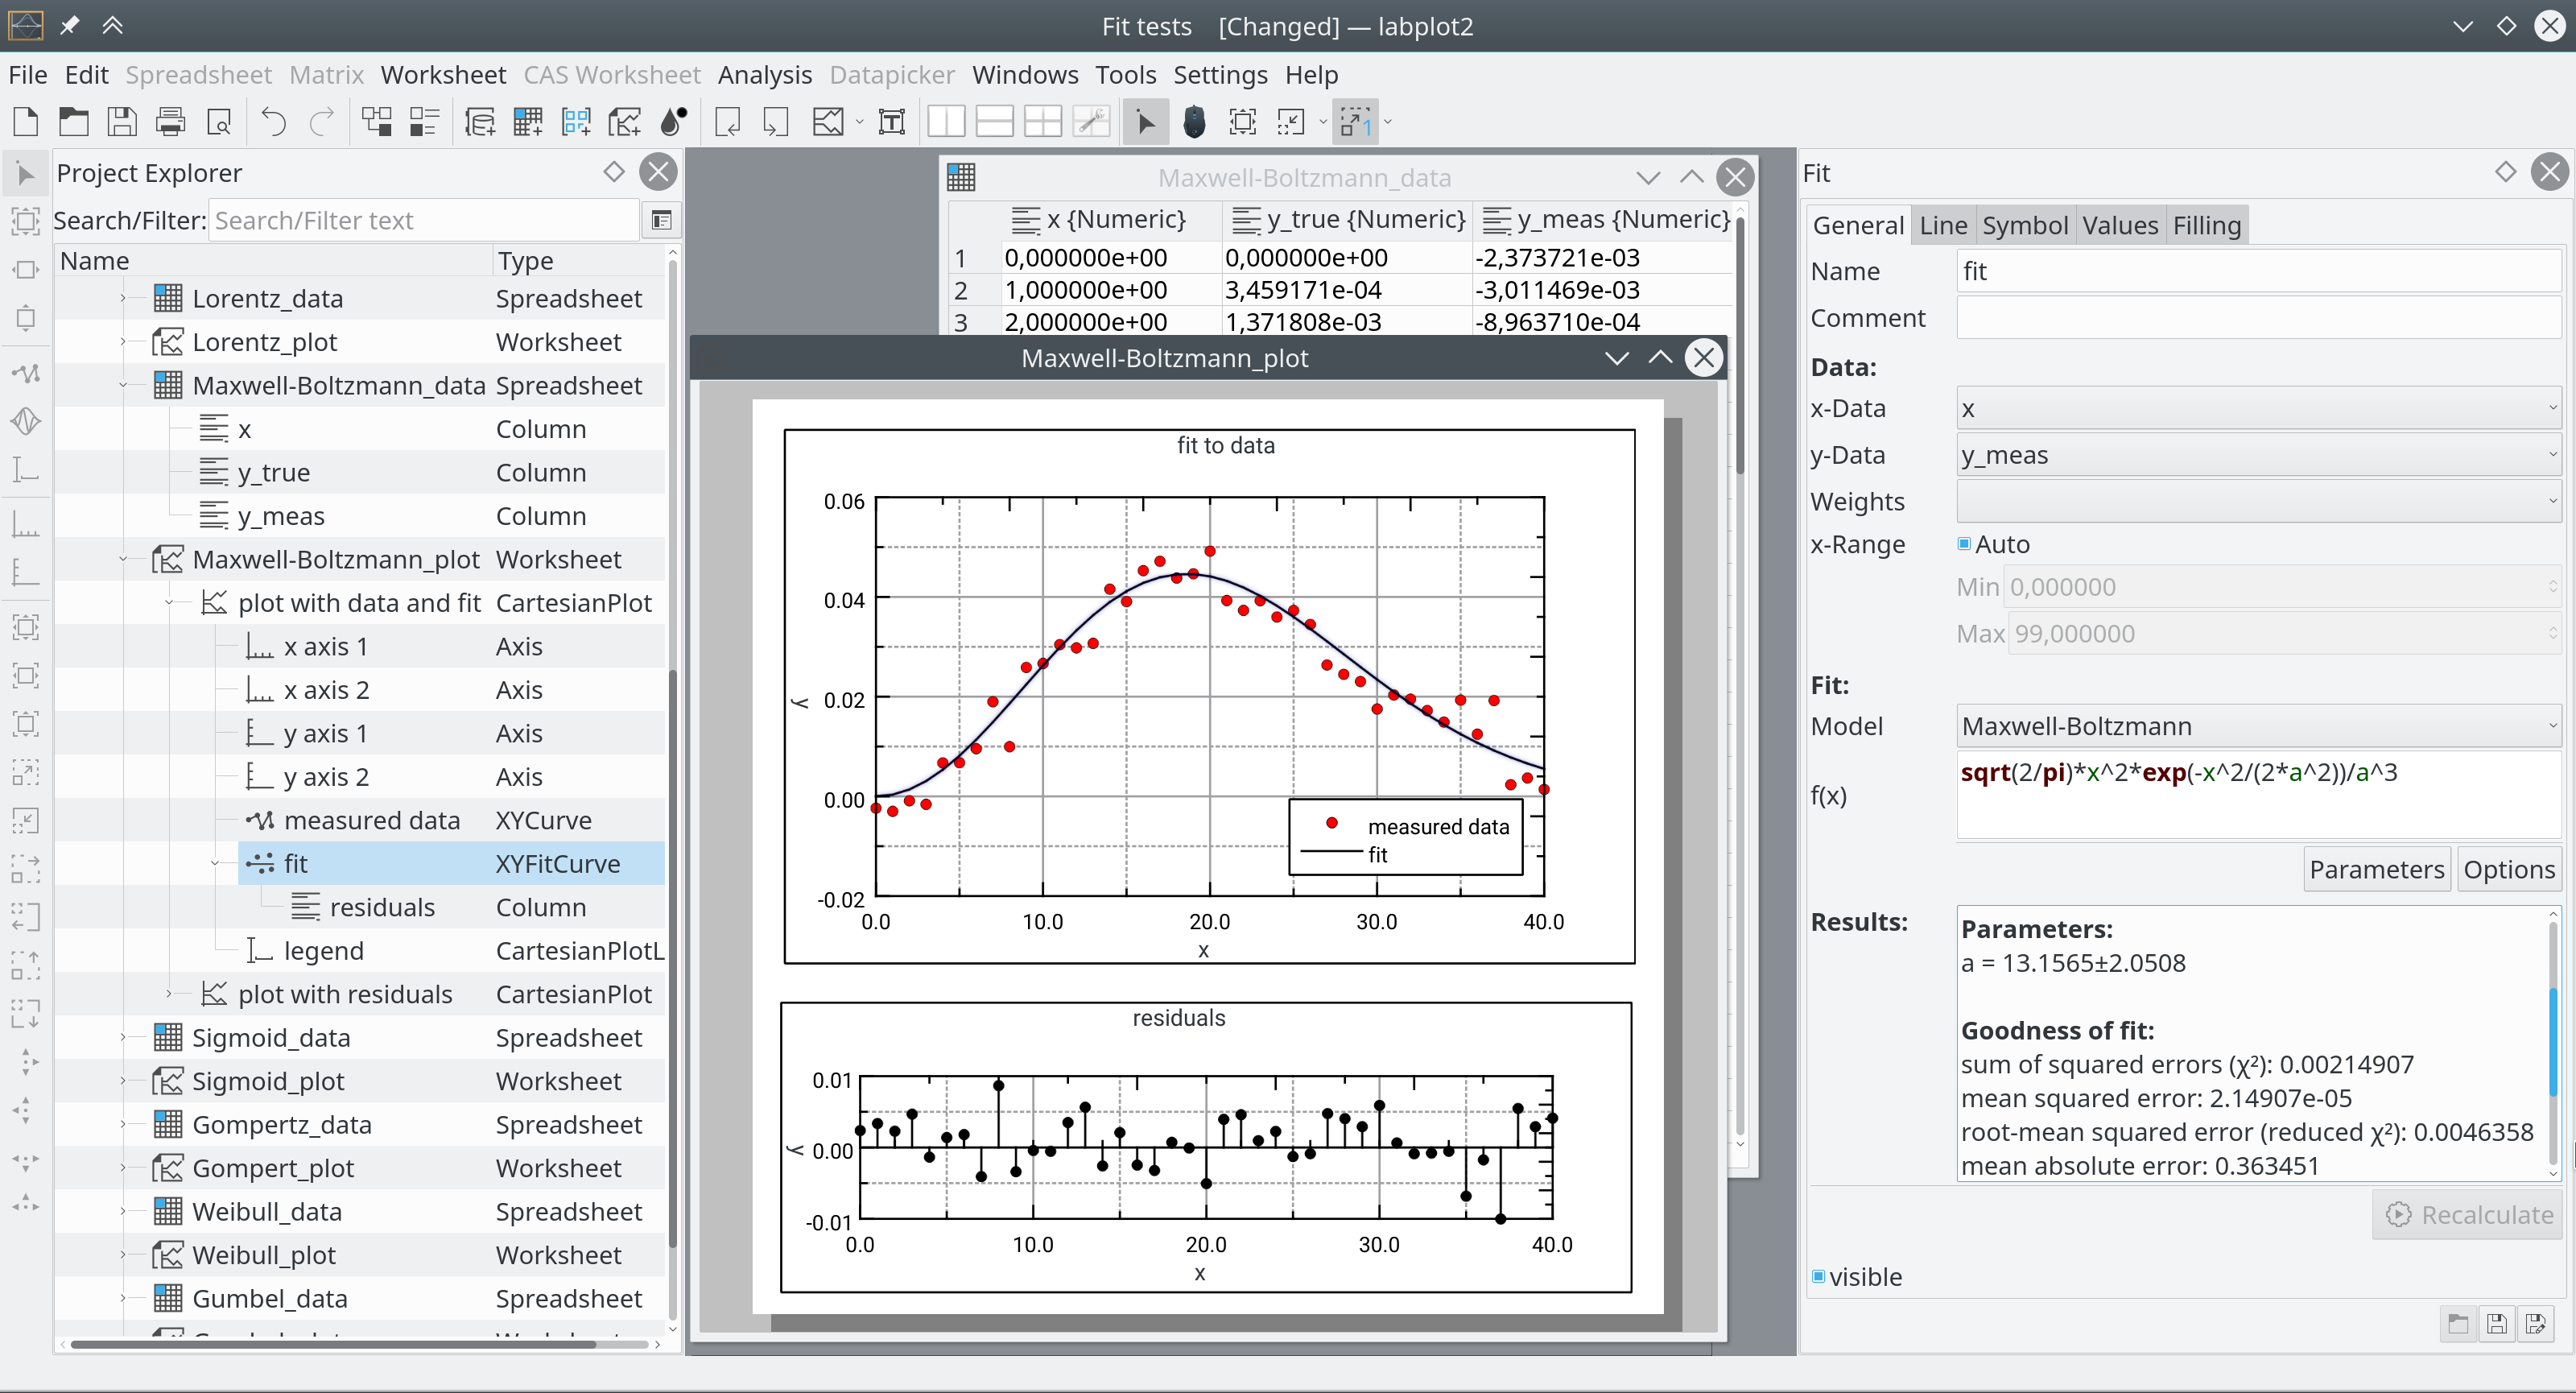
LabPlot is a free software and cross-platform computer program for interactive scientific graphing and data analysis, written for the KDE desktop.
General
- Project based management of data
- Tree-like organization (parent-child hierarchy) of created object, navigation is done in Project Explorer
- Folders and sub-folders within the project for a better object management
- Spreadsheet and Matrix – data-container serving as the data source used in data analysis and visualization
- Worksheet – area for placing different visualization objects (plots, labels, images, etc) supporting different layouts, zooming and navigation modi
- Extensive and interactive editing capabilities
- Support for Latex syntax in labels (plot and axis titles, etc.)
- Extensive parser for mathematical expressions supporting great number of functions and constants, used for data generation, analysis and visualization
- Elaborative documentation supporting the user with detailed examples und tutorials
2D-Plotting
- Cartesian plot with an arbitrary number of freely positionable axes
- Ordinary and cumulative histograms with different binning methods
- Several zooming and navigation modi in the plot
- Feature-rich and freely positionable plot legend
- Arbitrary number of curves in the plot, defined either via a mathematical equation or by providing data sources
Data Analysis
- Linear and non-linear regression analysis, support for several predefined and user-defined fit models
- Numerical differentiation (up to the 6th order) and numerical integration (rectangular, trapezoid and Simpson methods)
- Smoothing of data with moving average, Savitzky-Golay and percentile filter methods
- Interpolation of data, support for many methods (linear, polynom, splines, piecewise cubic Hermite polynoms, etc.).
- Fourier transform of the input data with support for many different window functions (Hann, Hamming, Blackman, etc.)
- Fourier Filter – low-pass, high-pass, band-pass and band-reject filters of different types (Butterworth, Chebyshev I+II, Legendre, Bessel-Thomson)
- Convolution and deconvolution of data sets
- Auto- and cross-correlation of data sets
Computing
- Support for different open-source computer algebra systems (CAS) like Maxima, Octave, etc.
- Computation can be done directly in LabPlot, provided the corresponding CAS is installed
- CAS variables holding array-like data (Maxima lists, Python lists and tuples, etc.) can be used as the source for LabPlot curves
Import/Export
- Support for ASCII, binary, HDF5, netCDF, FITS, ROOT, Ngspice and JSON formats with many options to control the import process
- For hierarchical formats like HDF5, netCDF, FITS and ROOT user-friendly visualization of the file content for data navigation and selection is available
- Import of Origin® projects
- Export of Worksheet (entire worksheet or current selection) to PDF, EPS, PNG and SVG
- Export of data containers Spreadsheet and Matrix to Latex tables
- Support for drag&drop of files to be imported
Tools
- Datapicker for easy extraction of data from external image files
- Editor for FITS-tags allowing the modification of FITS metadata

