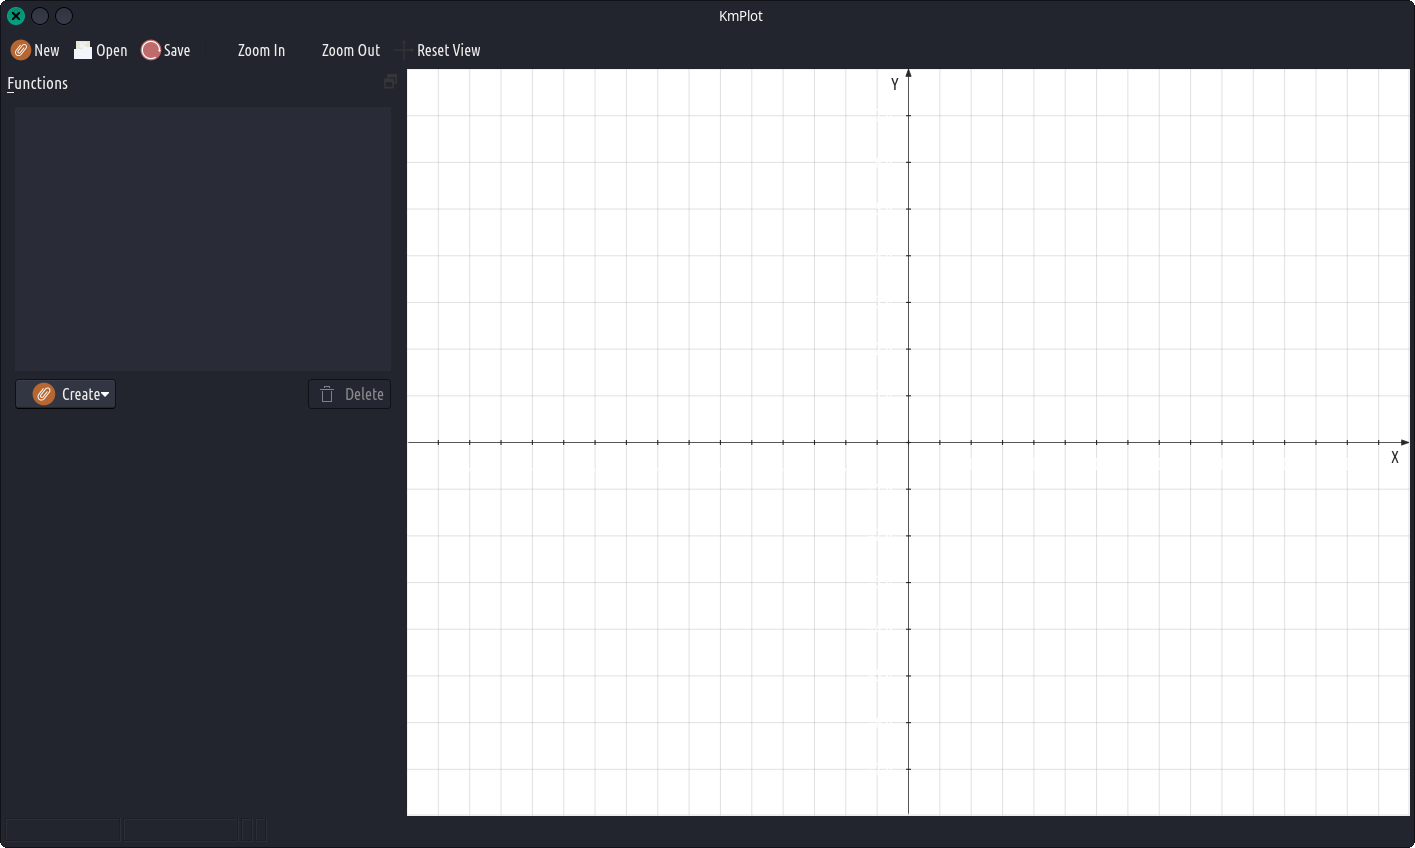
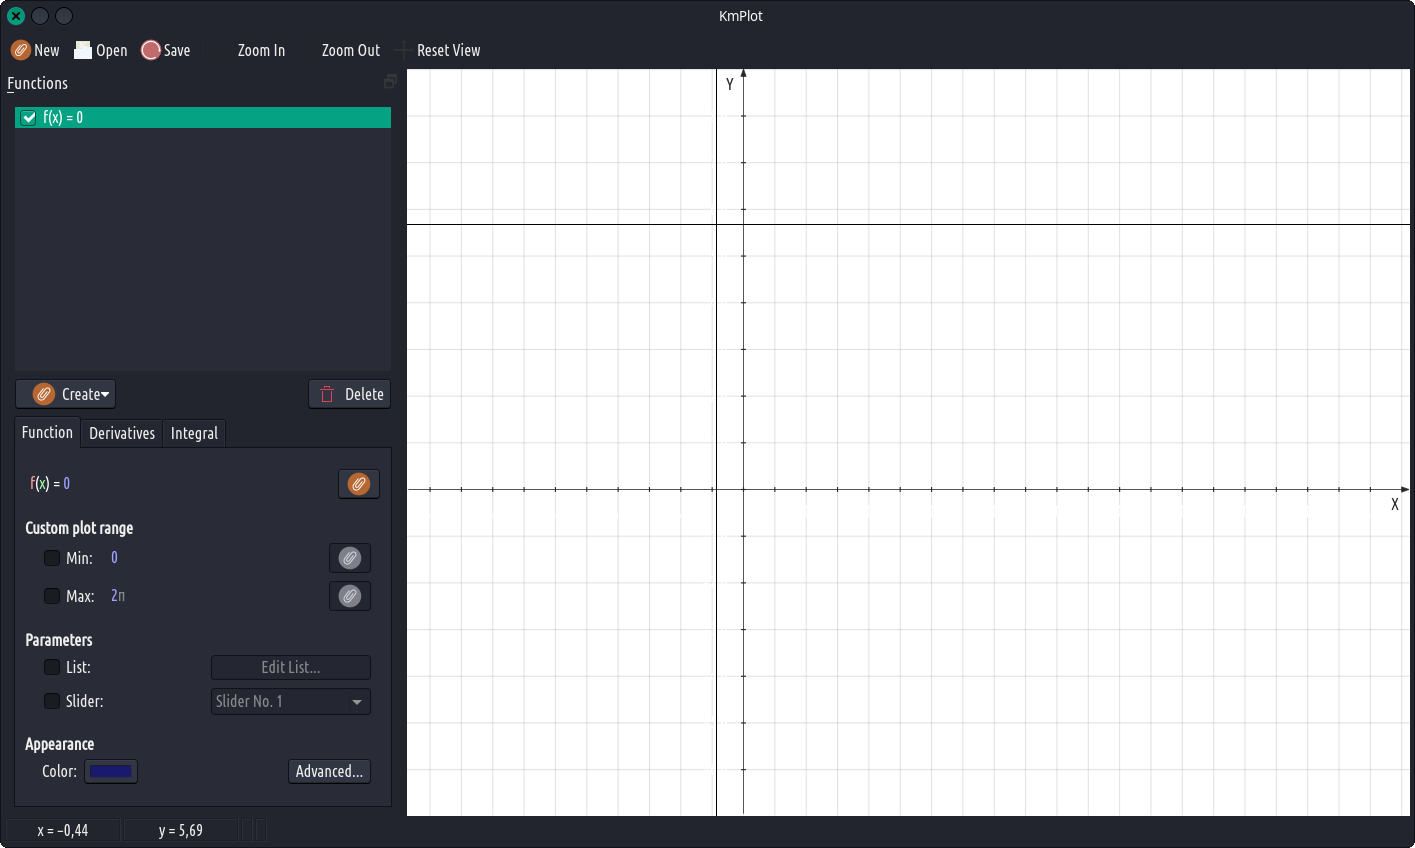
KmPlot — це програма для побудови графіків функцій, їхніх інтегралів або похідних. Графіки можна розфарбовувати, а перегляд легко налаштовувати, масштабувати та масштабувати. Програма містить потужний математичний аналізатор, різні типи графіків (декартовий, параметричний, полярний, неявний, диференціальний) і надає прості математичні інструменти, наприклад для знаходження максимуму/мінімалу функції. Параметризовані функції можна візуалізувати, регулюючи змінний параметр за допомогою повзунка. Ділянки можна експортувати як зображення у растровому форматі (BMP, PNG) і роздрукувати.