
лабораториялык участок
ээрчүү
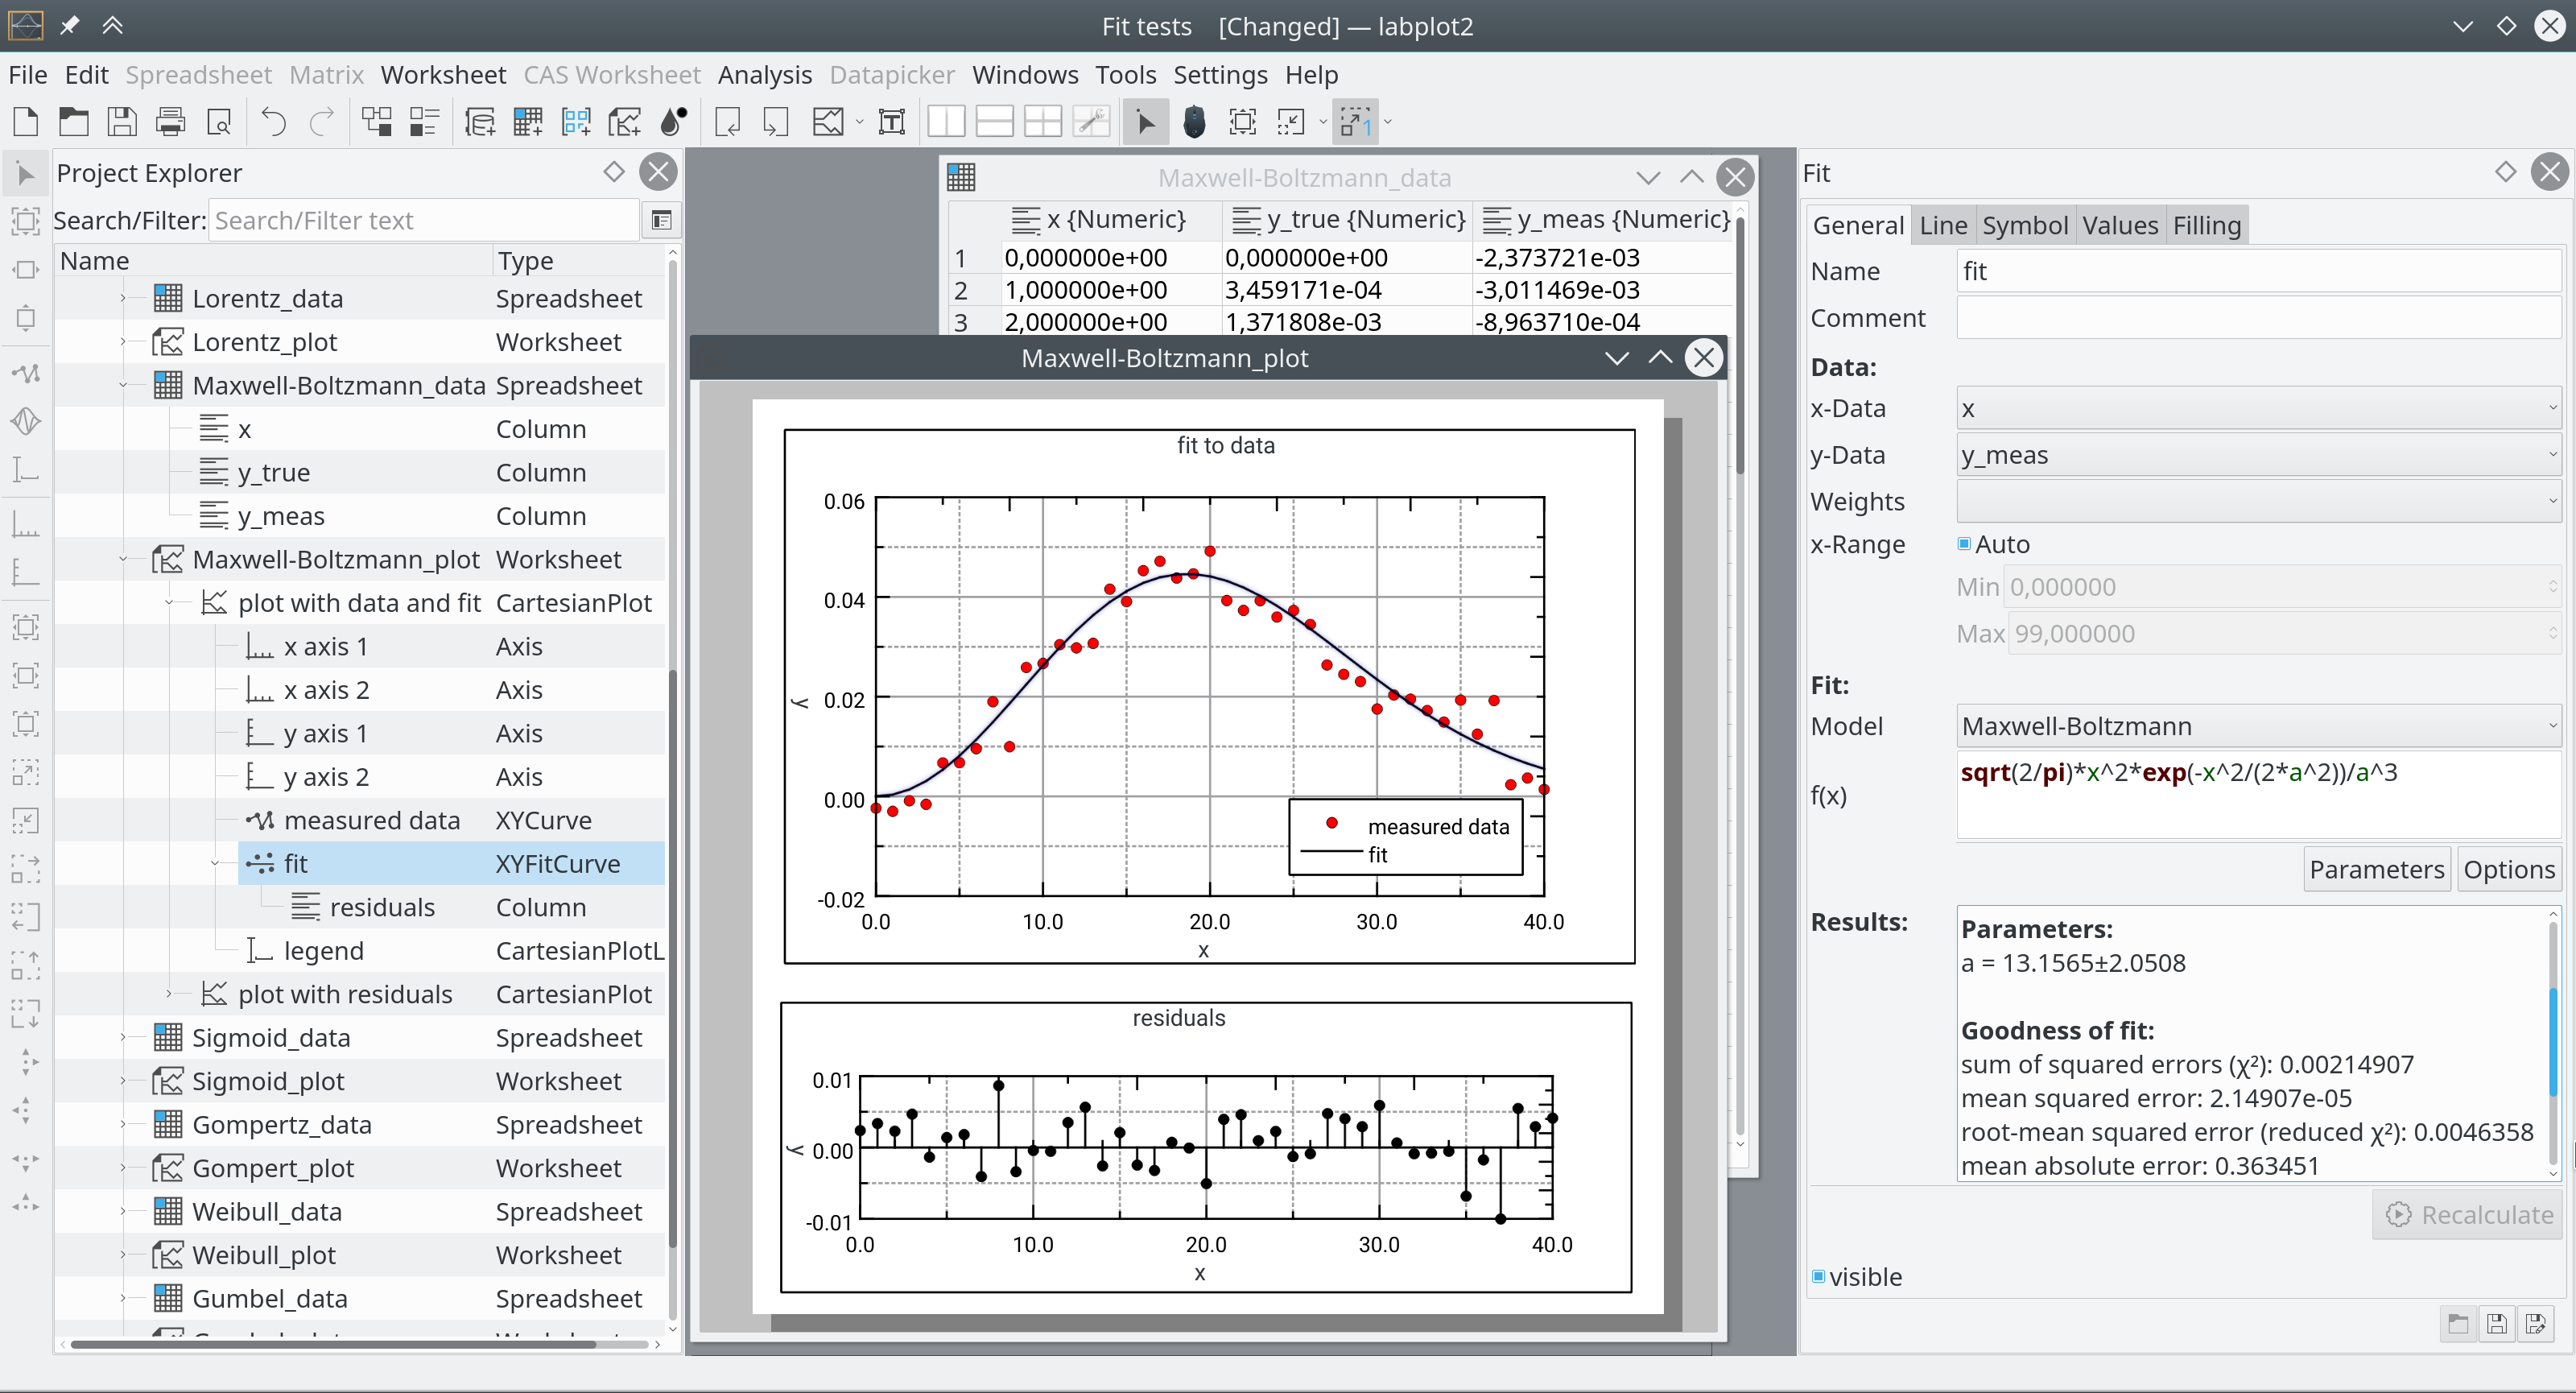
LabPlot – бул KDE иш тактасы үчүн жазылган интерактивдүү илимий графика жана маалыматтарды талдоо үчүн акысыз программалык камсыздоо жана кайчылаш платформалуу компьютер программасы.
Генерал
- Долбоордун негизинде маалыматтарды башкаруу
- Түзүлгөн объекттин дарак сымал уюштурулушу (ата-эне-бала иерархиясы), навигацияда жасалат Project Explorer
- Объектти жакшыраак башкаруу үчүн долбоордун ичиндеги папкалар жана суб-папкалар
- Электрондук жадыбал ээрчүү Матрица – маалыматтарды талдоодо жана визуалдаштырууда колдонулган маалымат булагы катары кызмат кылган маалымат-контейнер
- Жумуш баракчасы – ар кандай визуализация объектилерин (сюжеттерди, энбелгилерди, сүрөттөрдү ж.б.) жайгаштыруу үчүн, ар кандай макеттерди, масштабды жана навигация режимдерин колдогон аймак
- Кеңири жана интерактивдүү түзөтүү мүмкүнчүлүктөрү
- Энбелгилерде латекс синтаксисин колдоо (сюжет жана ок аталыштары ж.б.)
- Көп сандаган функцияларды жана константаларды колдогон математикалык туюнтмалар үчүн кеңири анализдөөчү, маалыматтарды түзүү, талдоо жана визуалдаштыруу үчүн колдонулат
- Колдонуучуну деталдуу мисалдар жана окуу куралдары менен колдогон иштеп чыгуучу документтер
2D-плотинг
- Эркин жайгашуучу октордун ыктыярдуу саны менен декарттык сюжет
- Кадимки жана кумулятивдик гистограммалар ар кандай бириктирүү ыкмалары менен
- Сюжетте бир нече чоңойтуу жана навигация режимдери
- Функцияга бай жана эркин позицияланган сюжет легендасы
- Математикалык теңдеме аркылуу же маалымат булактарын берүү менен аныкталган графиктеги ийри сызыктардын ыктыярдуу саны
Маалыматтарды талдоо
- Сызыктуу жана сызыктуу эмес регрессия анализи, бир нече алдын ала аныкталган жана колдонуучу аныктаган туура моделдерин колдоо
- Сандык дифференциация (6-тартипке чейин) жана сандык интеграция (тик бурчтуу, трапеция жана Симпсон ыкмалары)
- Кыймылдуу орточо, Савицки-Голай жана пайыздык чыпка ыкмалары менен маалыматтарды жылмалоо
- Маалыматтарды интерполяциялоо, көптөгөн методдорду колдоо (сызыктуу, полином, сплайн, бөлүкчөлүү куб Гермит полиномдору ж.б.).
- Көптөгөн ар кандай терезе функцияларын колдоо менен киргизилген маалыматтарды Фурье трансформациясы (Ганн, Хамминг, Блэкман ж.б.)
- Фурье фильтри – ар кандай типтеги төмөн өткөрүүчү, жогорку өткөрүүчү, тилкелүү жана тилкелик четке кагуучу чыпкалар (Баттерворт, Чебышев I+II, Леджендре, Бессель-Томсон)
- Маалымат топтомдорун конволюциялоо жана деконволюциялоо
- Маалымат топтомдорунун авто- жана кайчылаш-корреляциясы
Эсептөө
- Maxima, Octave, ж.
- Тиешелүү CAS орнотулган шартта, эсептөөнү түздөн-түз LabPlotто жасоого болот
- Массив сыяктуу маалыматтарды камтыган CAS өзгөрмөлөрү (Максима тизмелери, Python тизмелери жана кортеждер ж.б.) LabPlot ийри сызыктарынын булагы катары колдонулушу мүмкүн
Импорт/Экспорт
- Импорт процессин көзөмөлдөө үчүн көптөгөн варианттары бар ASCII, бинардык, HDF5, netCDF, FITS, ROOT, Ngspice жана JSON форматтарын колдоо
- HDF5, netCDF, FITS жана ROOT сыяктуу иерархиялык форматтар үчүн маалыматтарды навигациялоо жана тандоо үчүн файлдын мазмунунун колдонуучуга ыңгайлуу визуализациясы бар
- Origin® долбоорлорунун импорту
- Иш барагын (бардык иш барагы же учурдагы тандоо) PDF, EPS, PNG жана SVGге экспорттоо
- Электрондук жадыбалды жана матрицаны Латекс таблицаларына маалымат контейнерлерин экспорттоо
- Support for drag&drop of files to be imported
Куралдар
- Маалымат тандагыч тышкы сүрөт файлдарынан маалыматтарды оңой алуу үчүн
- FITS-тегдер үчүн редактор FITS метадайындарын өзгөртүүгө мүмкүндүк берет

