
komploya laboratorê
TERÎF:
LabPlot nermalava belaş û bernameyek komputerê ya cross-platform e ji bo grafîka zanistî ya înteraktîf û analîza daneyan, ku ji bo sermaseya KDE hatî nivîsandin.
Giştî
- Projeya rêveberiya daneyê ya bingehîn
- Organîzasyona mîna darê (hiyerarşiya dêûbav-zarok) ya tiştê hatî afirandin, navîgasyon tê de tête kirin Projeya Explorer
- Peldank û bin-peldankên di hundurê projeyê de ji bo rêvebirinek çêtir çêtirîn
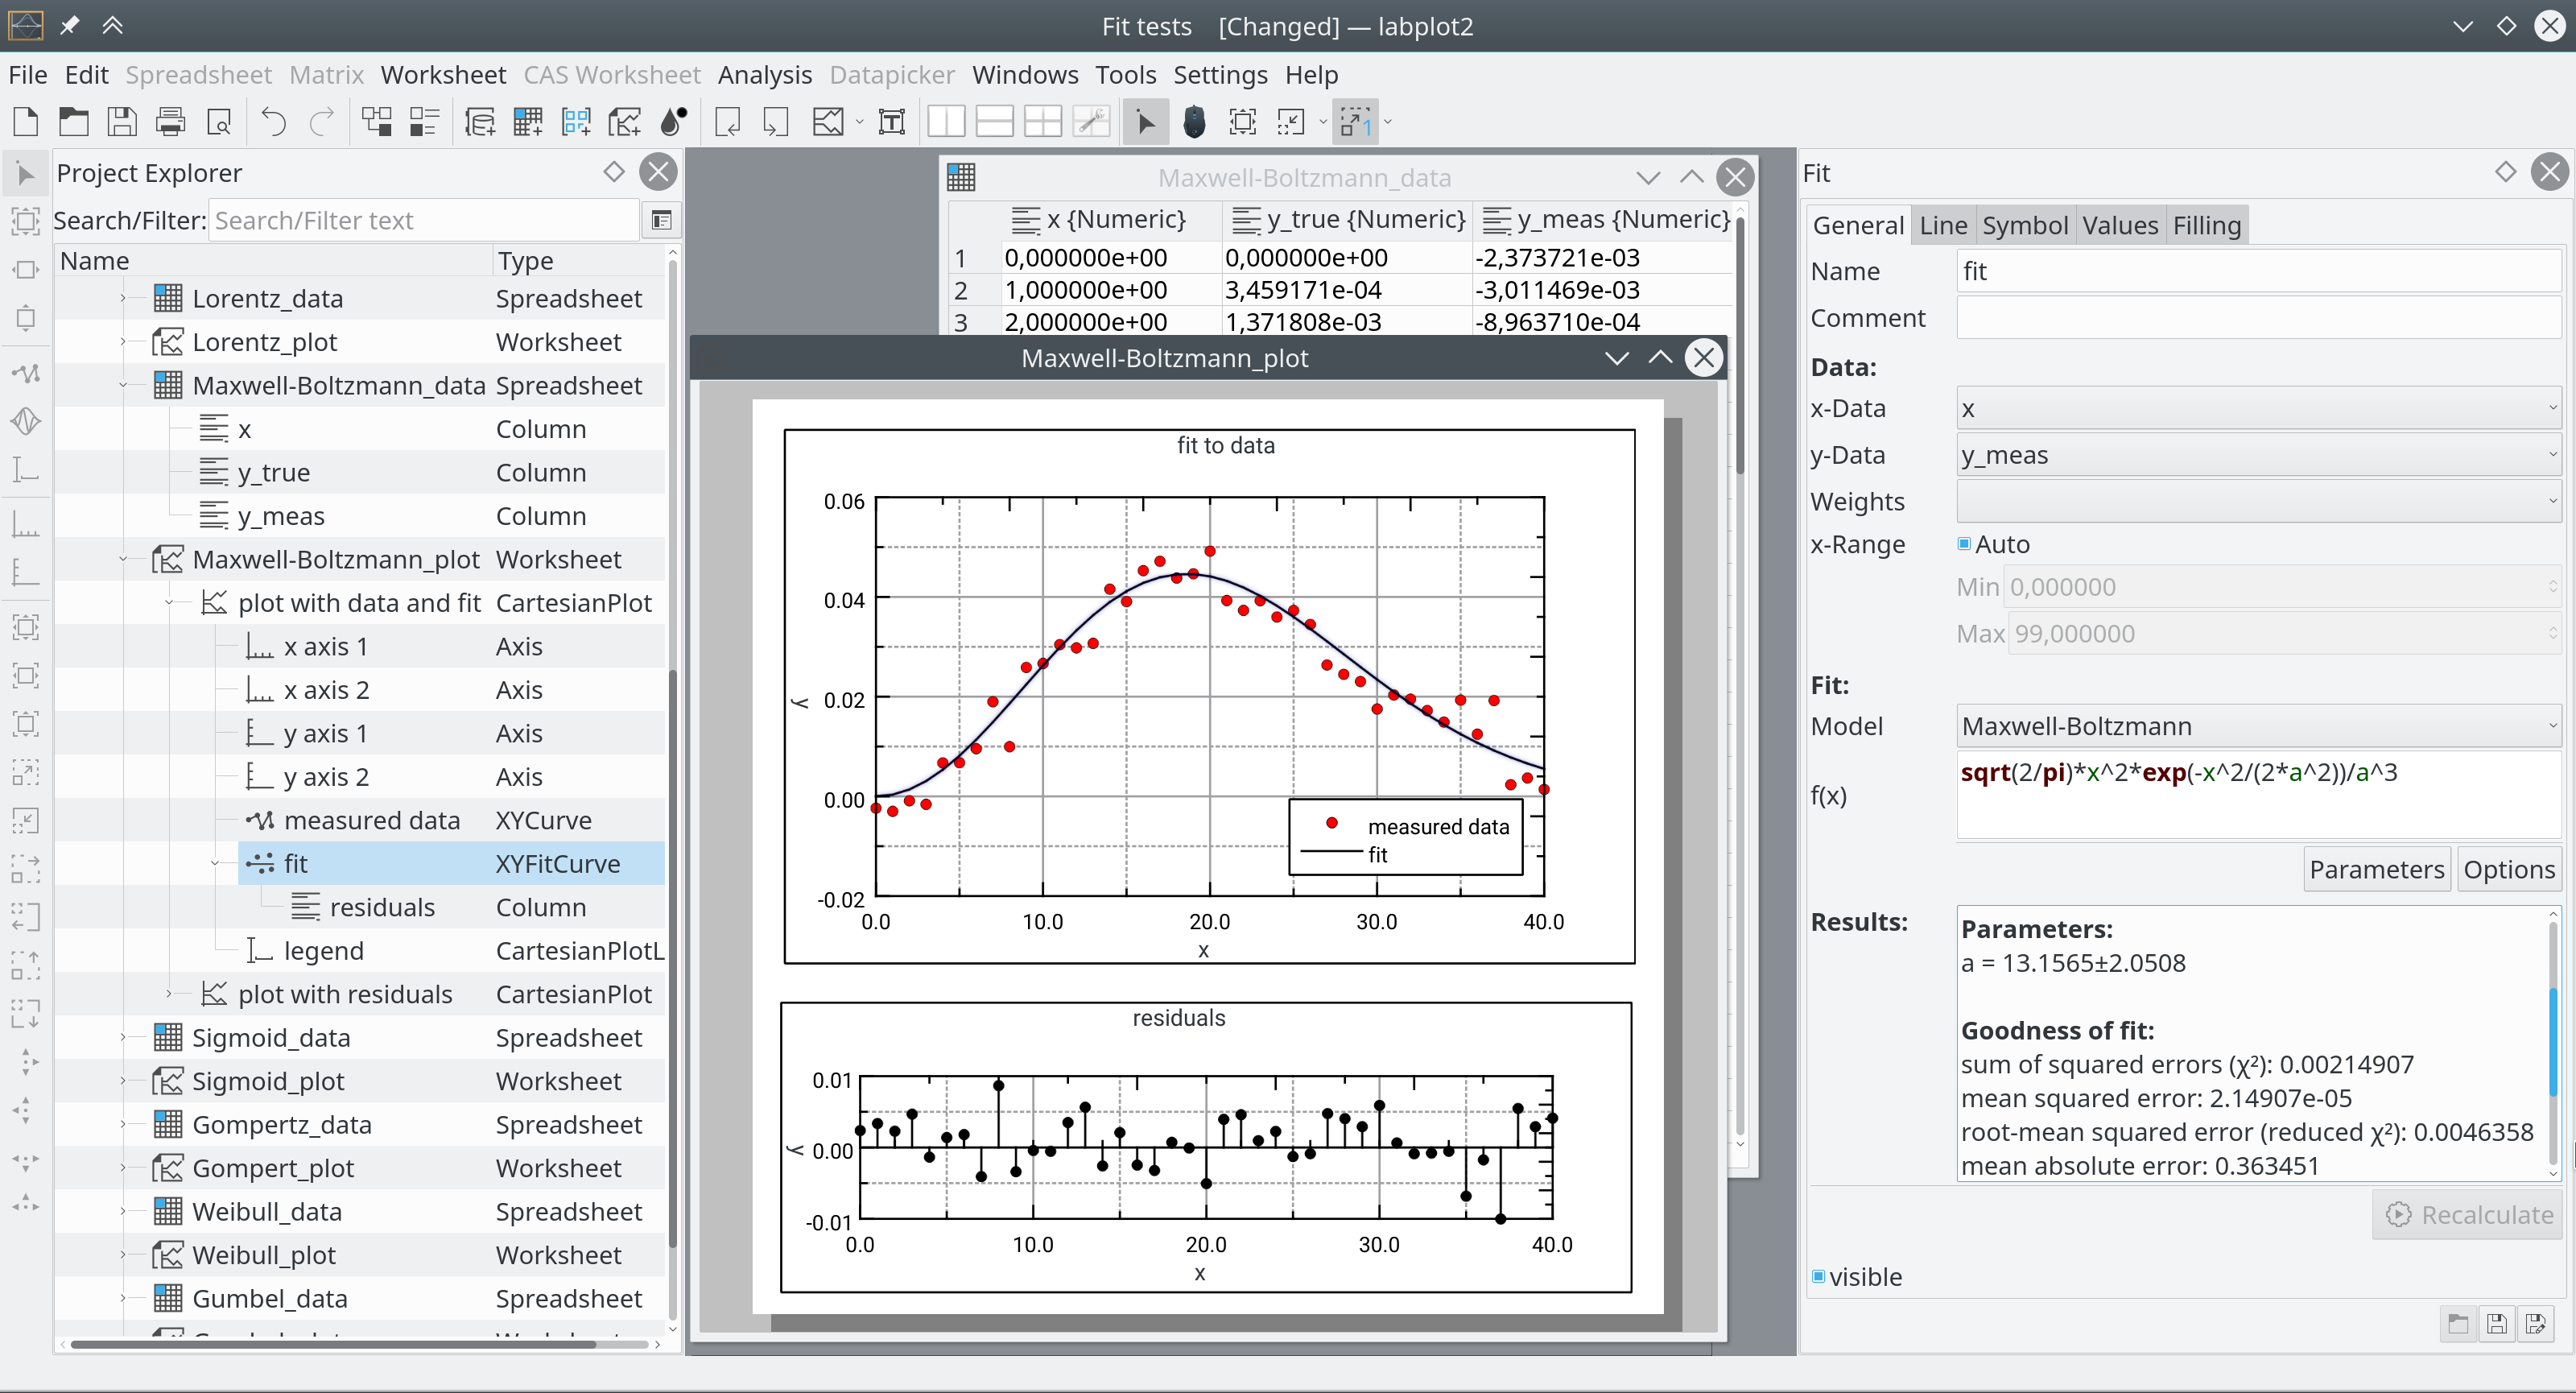
- Spreadsheet Em hewl didin ku sermaseyek pir sade digel çend sepanên ku ji hêla xwerû ve hatine saz kirin biparêzin. Lê me hîs kir ku me du wenda dikin ku ji bo pir bikarhêneran girîng in: Matrix - konteynera daneyê ku wekî çavkaniya daneyê di analîzkirin û dîtinê de tê bikar anîn
- Worksheet - qada ji bo danîna tiştên dîtbarî yên cihêreng (pişk, etîket, wêne, hwd.) piştgirî dide sêwiranên cihêreng, zoom û modên navîgasyonê
- Kapasîteyên guherandinê yên berfireh û înteraktîf
- Piştgiriya hevoksaziya Latex di etîketan de (sernavên xêz û eksê, hwd.)
- Parsera berfireh ji bo îfadeyên matematîkî ku hejmareke mezin ji fonksiyon û domdar piştgirî dike, ji bo hilberîna daneyan, analîzkirin û dîtinê tê bikar anîn.
- Belgekirina berfireh ku bikarhêner bi mînakên berfireh û dersan piştgirî dike
2D-Plotting
- Pîlanek Cartesian bi hejmarek keyfî ya axên ku bi serbestî têne pozîsyon kirin
- Histogramên asayî û komkirî yên bi awayên cihêreng binning
- Gelek modên zoom û navîgasyonê di nexşeyê de
- Efsaneya komployê ya bi taybetmendî û bi serbestî cihê xwe digire
- Hejmara kêfî ya kevokan di nexşeyê de, ku bi hevokek matematîkî ve an jî bi peydakirina çavkaniyên daneyê têne diyar kirin
Analysis Data
- Analîzkirina regresyonê ya xêz û ne-xêz, piştgirî ji bo çend modelên guncan ên pêşwext û diyarkirî yên bikarhêner
- Cûdahiya hejmarî (heta rêza 6-an) û entegrasyona hejmarî (rêbazên çargoşeyî, trapezoîd û Simpson)
- Paqijkirina daneyan bi rêgezên parzûna navîn, Savitzky-Golay û sedî
- Tevlihevkirina daneyan, piştgirî ji bo gelek rêbazan (xêz, polînom, splines, polînomên Hermite yên kubar, hwd.).
- Veguherîna Fourier ya daneyên têketinê bi piştgirîya gelek fonksiyonên pencereyê yên cihêreng (Hann, Hamming, Blackman, hwd.)
- Parzûna Fourier - Parzûnên nizm-derbas, bilind-derbas, band-derbas û band-pejirandinê yên celebên cûda (Butterworth, Chebyshev I+II, Legendre, Bessel-Thomson)
- Tevlihevkirin û vekêşana daneyên daneyan
- Xweser- û hevrêziya daneyên daneyan
Computing
- Piştgiriya ji bo pergalên cebrê yên komputerê yên çavkaniya vekirî (CAS) yên wekî Maxima, Octave, hwd.
- Hesab dikare rasterast di LabPlot de were kirin, bi şertê ku CAS-a têkildar were saz kirin
- Guherbarên CAS yên ku daneyên mîna rêzê digirin (lîsteyên Maxima, navnîşên Python û tîpan, û hwd.) dikarin wekî çavkanî ji bo kelûpelên LabPlot werin bikar anîn.
Import / Export
- Piştgiriya formatên ASCII, binary, HDF5, netCDF, FITS, ROOT, Ngspice û JSON bi gelek vebijarkan ji bo kontrolkirina pêvajoya import
- Ji bo formatên hiyerarşîk ên wekî HDF5, netCDF, FITS û ROOT dîmenderkirina bikarhêner-heval a naveroka pelê ji bo navîgasyon û hilbijartinê heye.
- Import of Origin® projeyên
- Hinardekirina Xebatê (tevahiya pelgeya xebatê an hilbijartina heyî) ji bo PDF, EPS, PNG û SVG
- Hinardekirina konteynerên daneyê Spreadsheet û Matrix bo tabloyên Latex
- Support for drag&drop of files to be imported
Amûrên
- Datapicker ji bo derxistina hêsan a daneyan ji pelên wêneya derveyî
- Edîtorê ji bo FITS-tags destûrê dide guherandina metadata FITS

