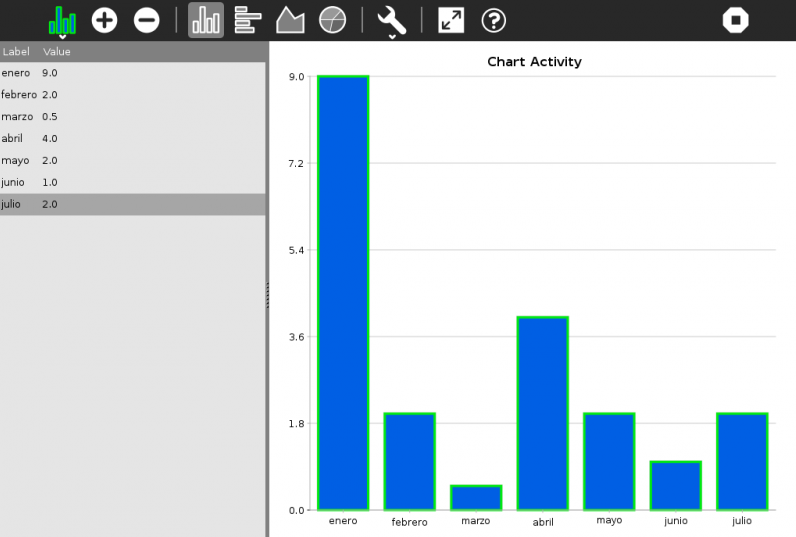
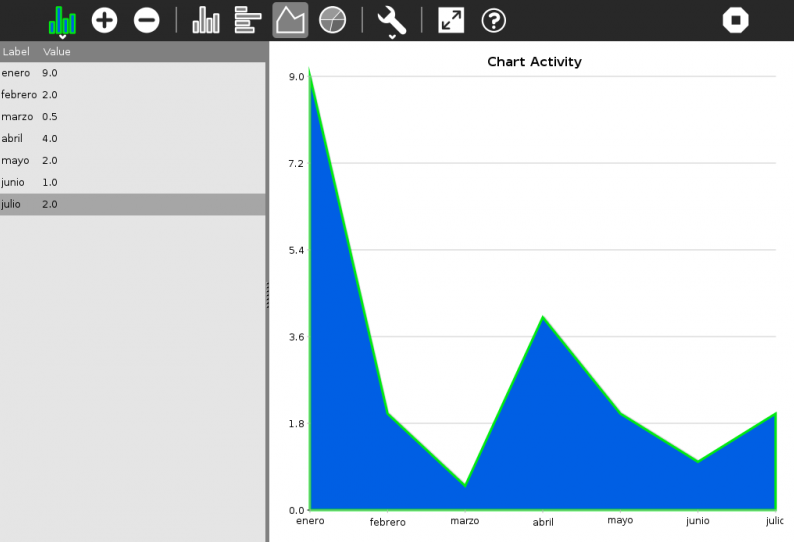
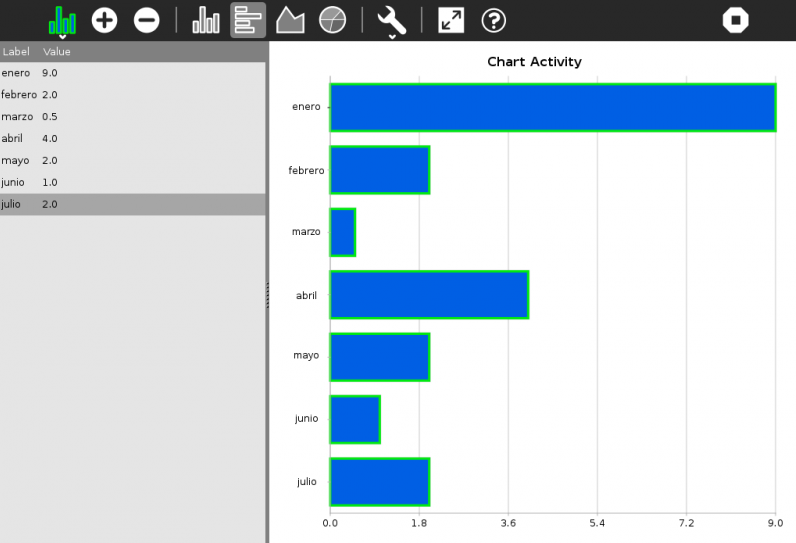
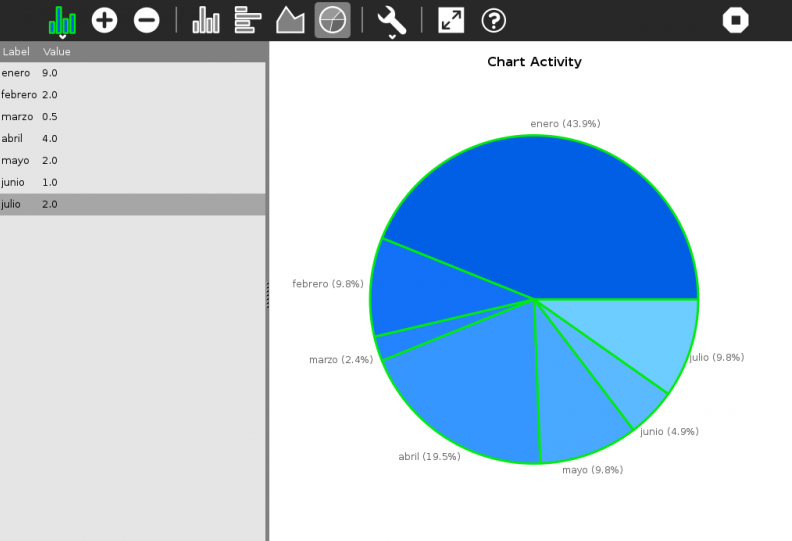
Di Bylinetrom sopra 6 febbraio 202214 luglio 2024 volta INSTALLARE DESCRIZIONE: Grafico ti consente di rappresentare graficamente semplici dati tabulari, nella forma "etichetta: valore". Può disegnare grafici a barre orizzontali/verticali, grafici a linee e grafici a torta. APP SIMILI: KDE Connect