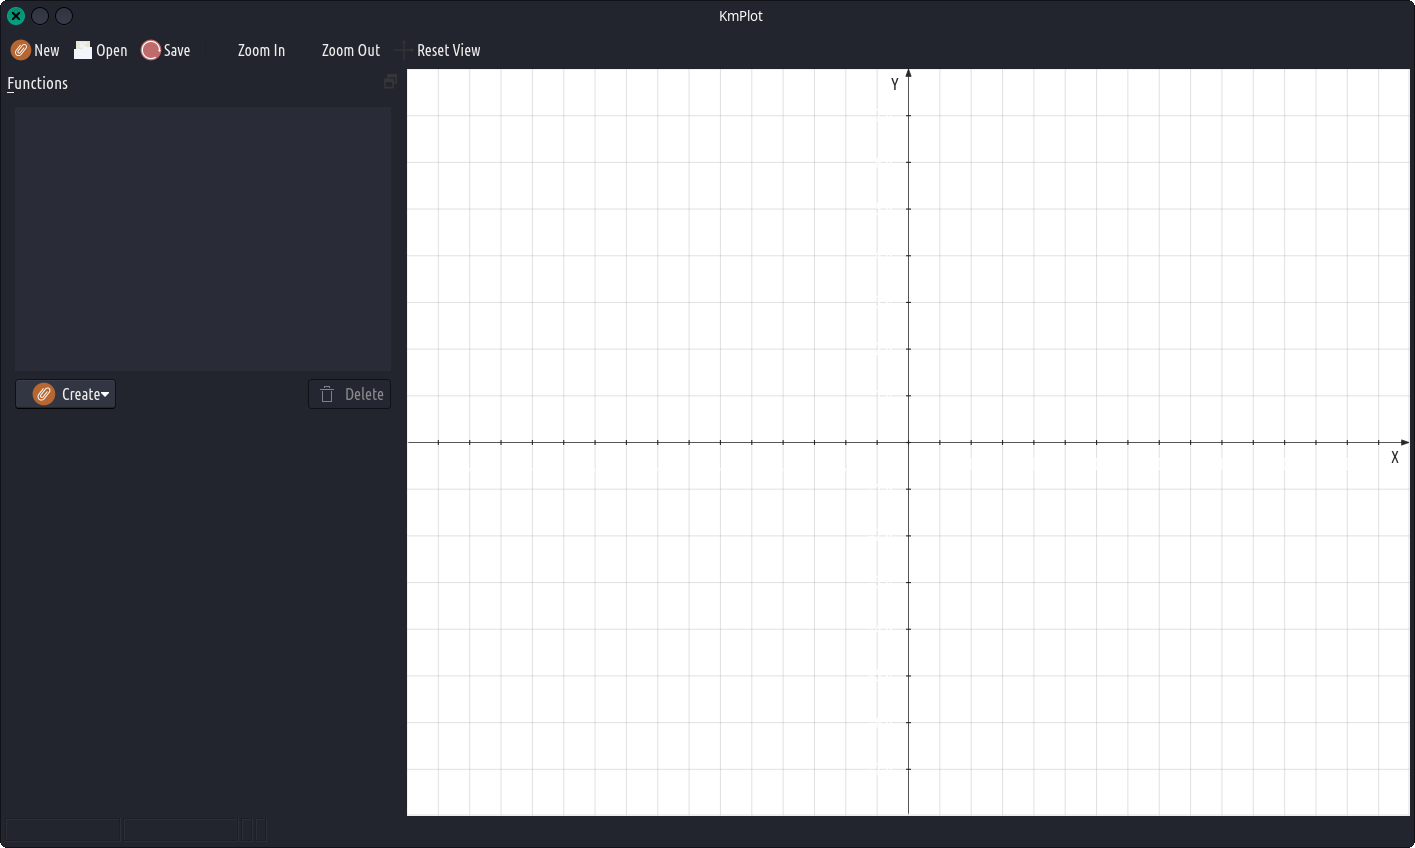
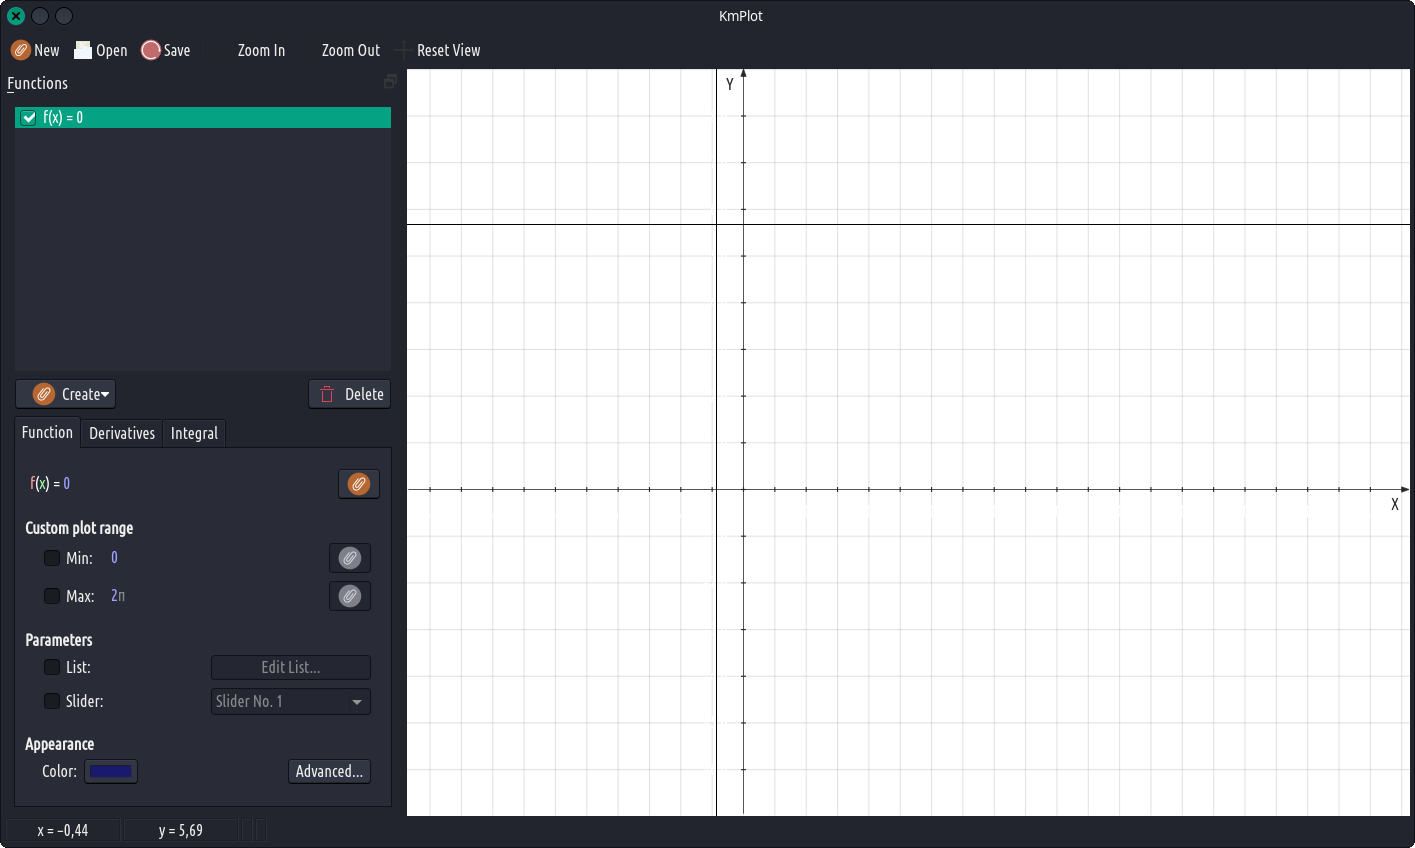
KmPlot on ohjelma funktioiden, niiden integraalien tai johdannaisten kuvaajien piirtämiseen. Kaaviot voidaan värittää ja näkymä on erittäin muokattavissa, skaalautuva ja zoomattavissa. Ohjelma sisältää tehokkaan matemaattisen jäsentimen, erilaisia juonityyppejä (karteesinen, parametrinen, polaarinen, implisiittinen, differentiaalinen) ja tarjoaa yksinkertaisia matemaattisia työkaluja, kuten funktion maksimi-/minimiarvon löytämiseen. Parametrisoidut funktiot voidaan visualisoida säätämällä muuttujaparametria liukusäätimellä. Tontit voidaan viedä bittikarttamuotoisina kuvina (BMP, PNG) ja ne voidaan tulostaa.