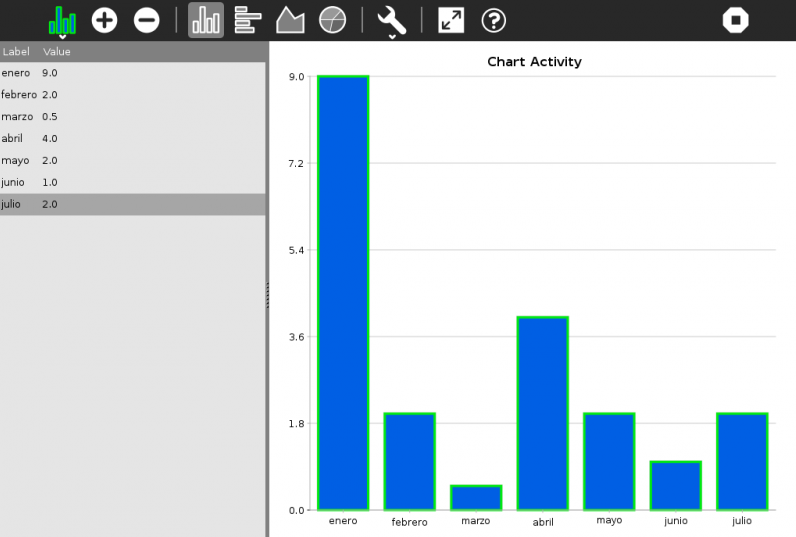
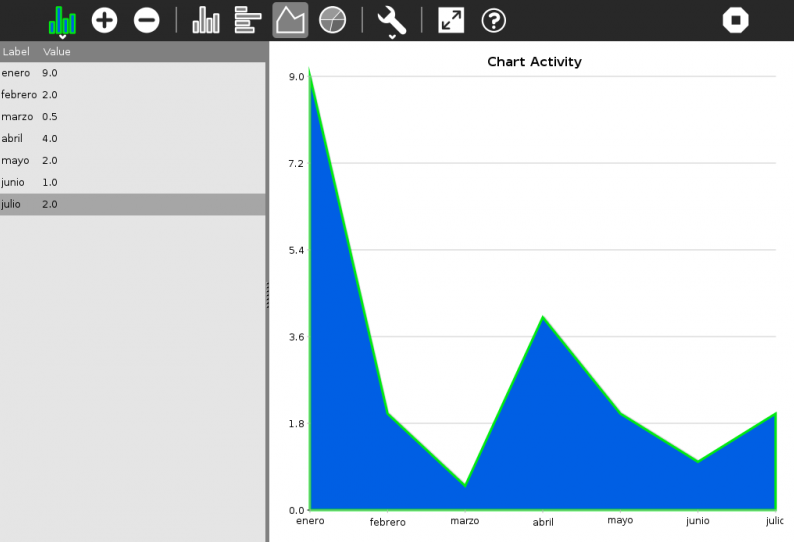
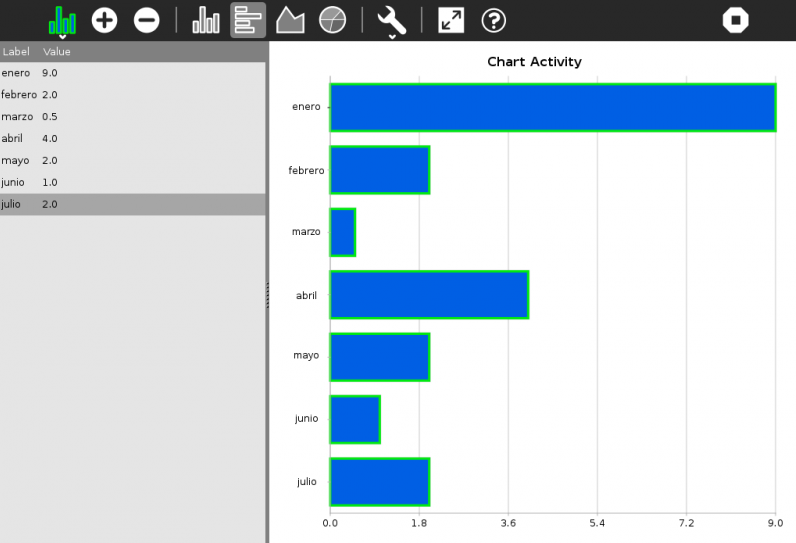
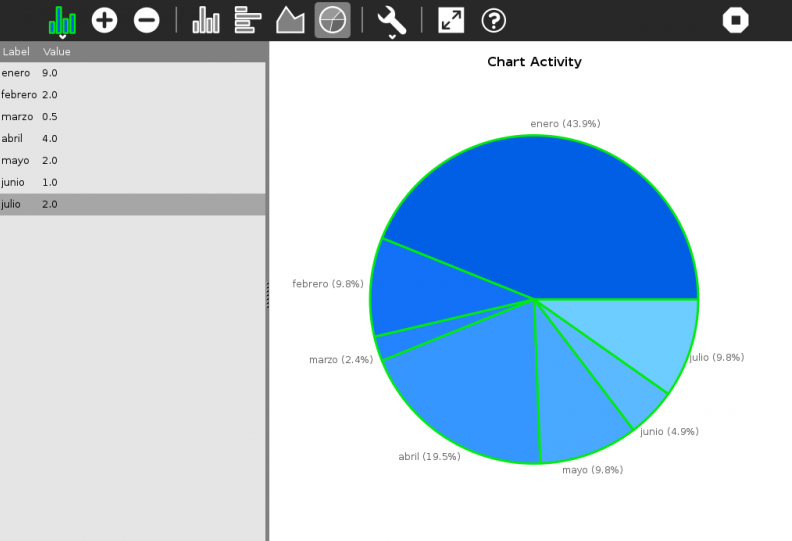
Por Línea de autortrom en 6 de febrero de 202214 de julio de 2024 [buscar a través de ~650 aplicaciones libres de comercio] INSTALAR DESCRIPCIÓN: El gráfico le permite realizar una representación gráfica de datos tabulares simples, en el formato "etiqueta: valor". Puede dibujar gráficos de barras horizontales/verticales, gráficos de líneas y gráficos circulares. APLICACIONES SIMILARES: Administrador de tareas