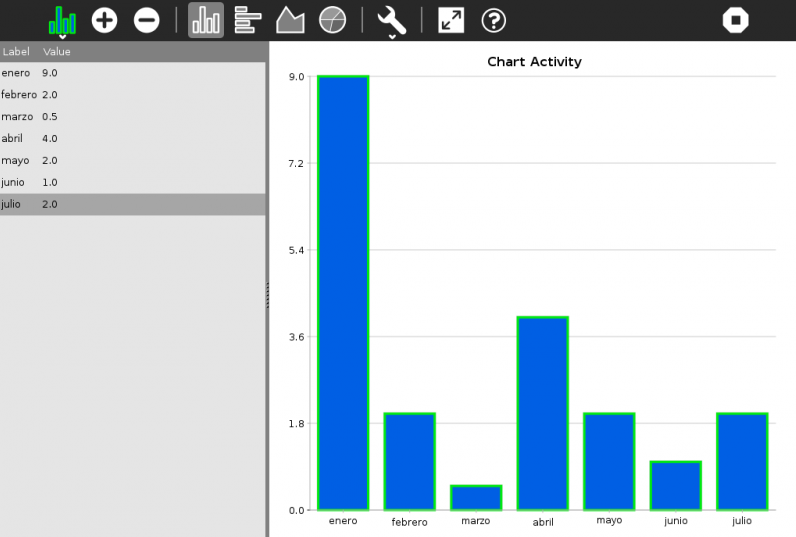
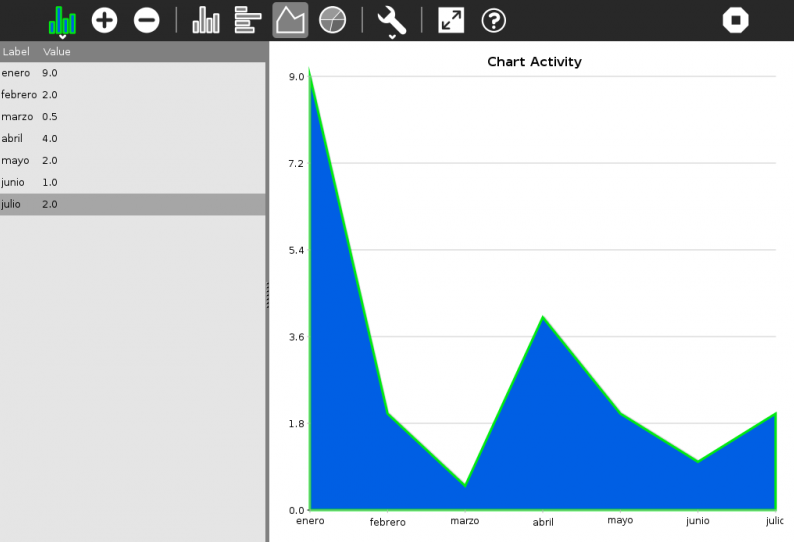
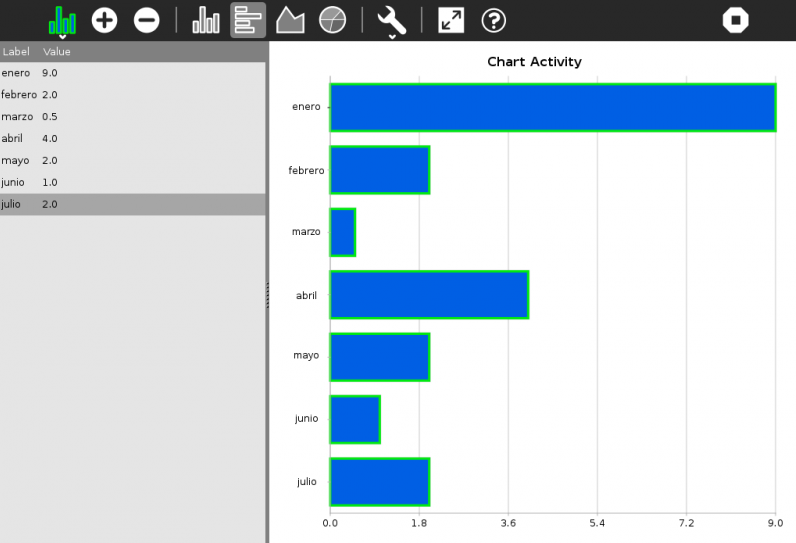
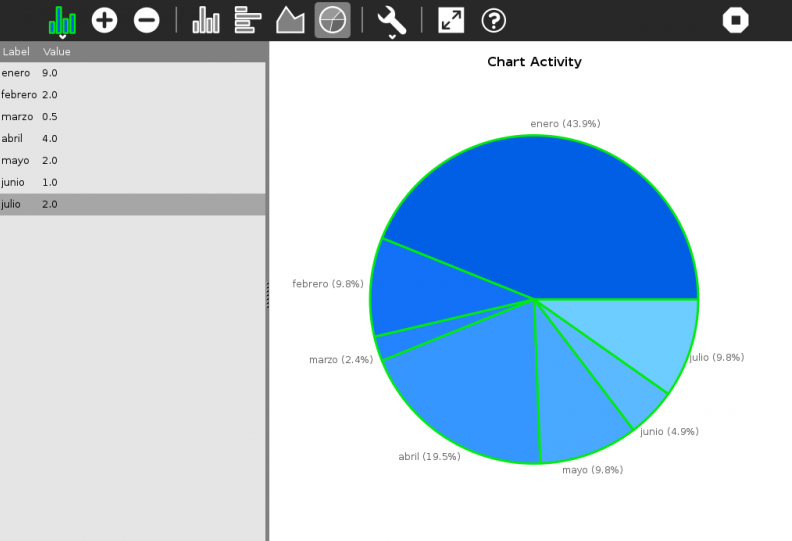
Per Bylinetrom encès 6 de febrer de 202214 de juliol de 2024 [cerca entre ~650 aplicacions sense comerç] INSTAL·LAR DESCRIPCIÓ: El gràfic us permet fer representacions gràfices de dades tabulars simples, en la forma "etiqueta: valor". Pot dibuixar gràfics de barres horitzontals/verticals, gràfics de línies i gràfics circulars. APLICACIONS SIMILARS: PSPP