
AlphaPlot
duab loader
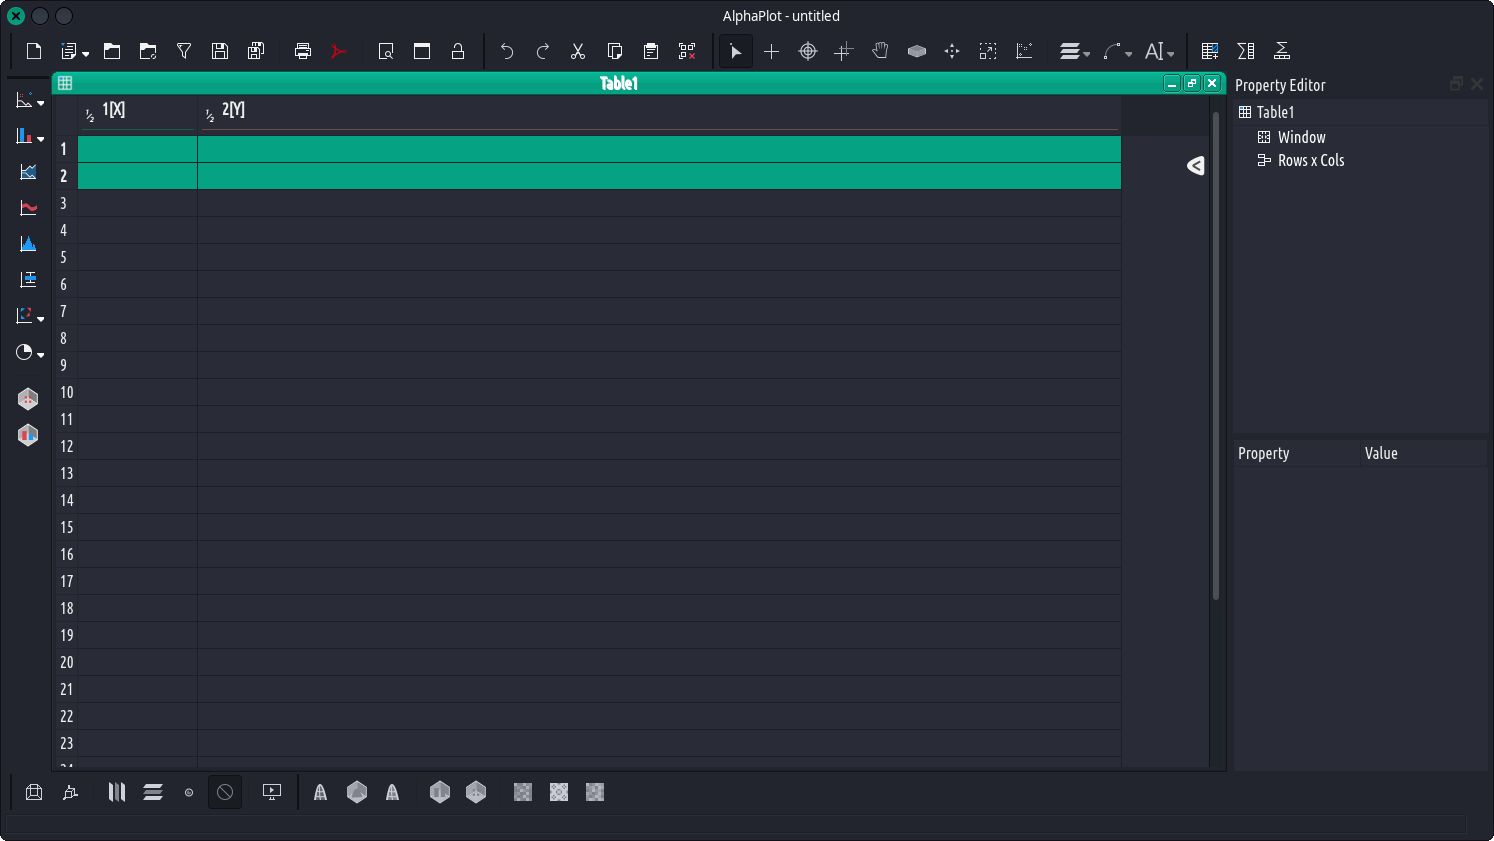
Alphaploplot yog qhov kev xaiv tshuab qhib rau kev sib tham nrog kev sib tham nrog kev tshawb fawb txog kev tshawb fawb thiab cov ntaub ntawv tsom xam. Nws tuaj yeem tsim ntau hom kev sib txawv ntawm 2D thiab 3d daim phiaj (xws li kab, bar, khoom noj, khoom noj qab zib, nkag mus los ntawm tes, lossis siv cov qauv.
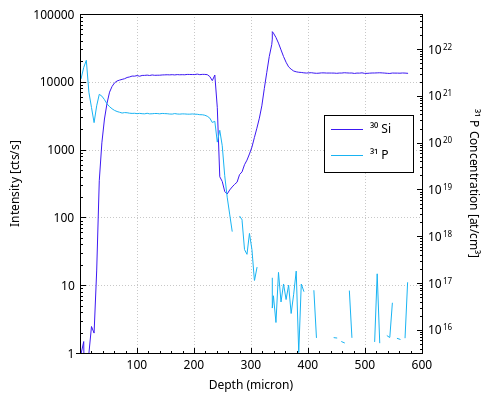
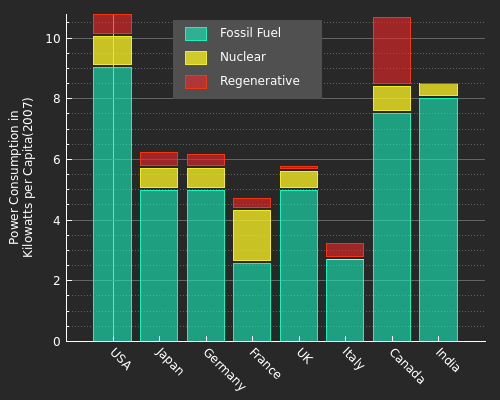
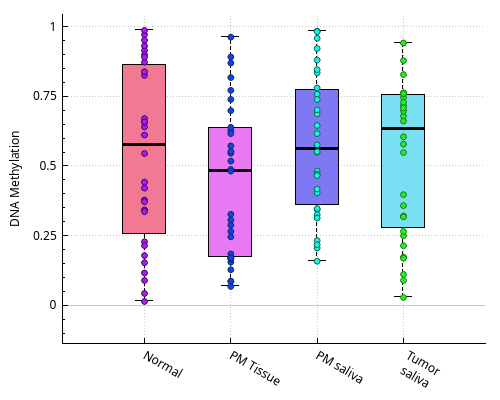
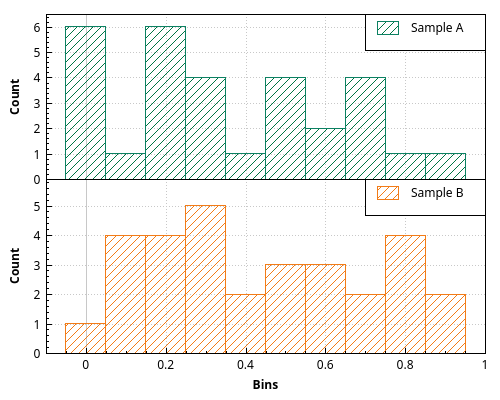
AlphaPlot can generate different types of 2D and 3D plots (such as line, scatter, bar, pie, and surface plots) from data that is either imported from ASCII files, entered by hand, or calculated using formulas. The data is held in spreadsheets which are referred to as tables with column-based data (typically X and Y values for 2D plots) or matrices (for 3D plots). The spreadsheets as well as graphs and note windows are gathered in a project and can be organized using folders. The built-in analysis operations include column/row statistics, (de)convolution, FFT and FFT-based filters. Curve fitting can be performed with user-defined or built-in linear and nonlinear functions, including multi-peak fitting, based on the GNU Scientific Library. The plots can be exported to several bitmap formats, PDF, EPS or SVG. Scripting Console support in-place evaluation of mathematical expressions and scrtipting interface to ECMAScript like dynamic scripting language(java script). The GUI of the application uses the Qt toolkit.


